Experiment to measure real accuracy on wearable swimming devices.
Summary
The purpose of this experiment is to simultaneously measure the reporting accuracy of SwiftSwim and Garmin Swim. SwiftSwim is a multi-platform application that you install and run in any IOS device and uses the sensors in the device to interpret and produce reports to identify your swimming performance. Garmin Swim is a wearable device in the form of a wrist watch that examines your movements and produces reports to identify your swimming performance. The IOS device and Garmin Swim must both be worn in the water in order to report swimming performance.
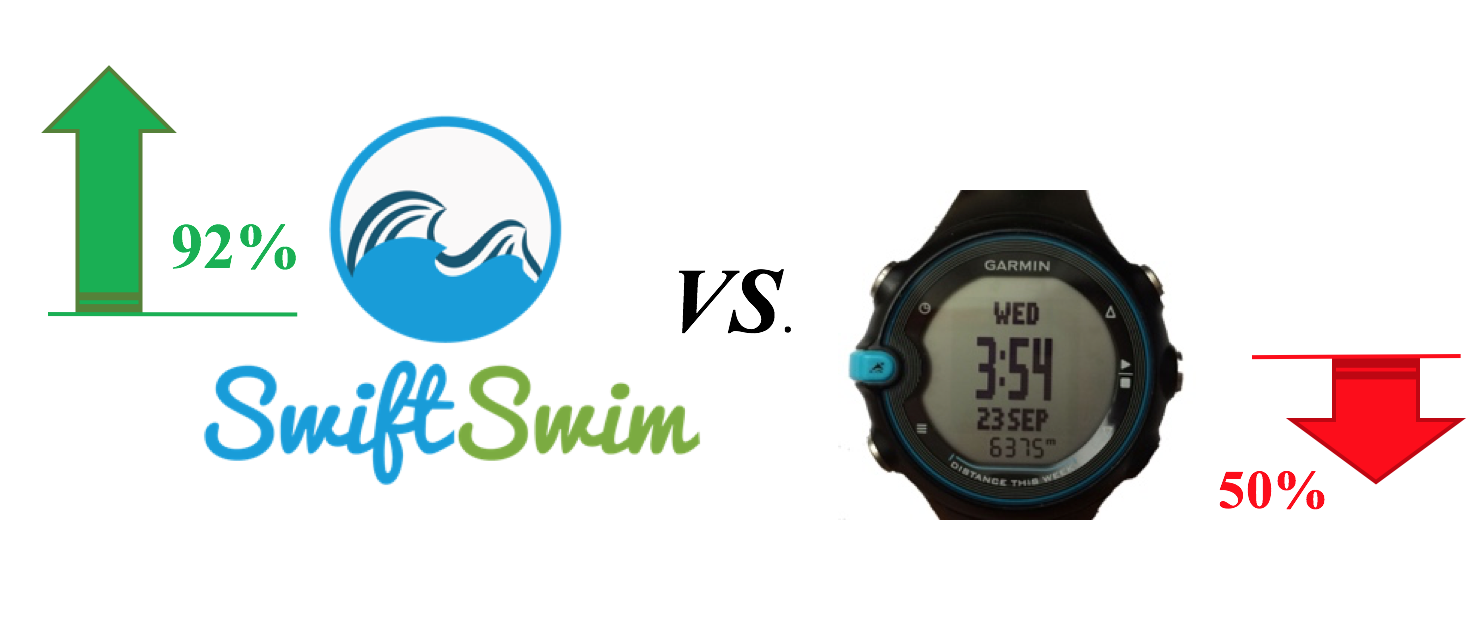
The experiment was performed throughout 7 days of swimming with almost 16 Km swam, 639 pools and 7067 one-arm strokes. The experiment mainly found that SwiftSwim has a 92% accuracy detecting a swimming style with a 3% error on Lap counting and 6% error on Stroke counting. On the other hand, Garmin Swim has only a 50% accuracy detecting the swimming style with a 13% error on Lap counting and 37% error on Stroke counting. In the upcoming sections we will describe the methodology of the experiment in detail as well as a full analysis of the results. The data was interpreted using R-Statistical program.
Methodology
The Experiment is designed to independently measure the reporting accuracy of both platforms.
The experiment is set up to measure the reporting accuracy of both devices using the same variables; in this case the movements related to swimming. The experiment was performed by swimming with both devices at the same time on the same arm. Simultaneous use of the devices allows for a clear comparison of both devices given the fact that they are capturing the same data from the same swims. In order to control for the accuracy of each device, we compared the reports of each platform to a control which we call a real swim. This real swim is data collected from videos that recorded the swimming at the same time the subject was swimming with both devices. The data was collected manually by counting the pools, number of strokes and styles and later creating a spreadsheet with all this data which will be used as the reference data to measure the overall accuracy of each platform. In total, this experiment was performed in 7 days of swimming with about 1 hour experiments on each day. Below is the collected data and the analysis.
This experiment was design to comply with the replication principles and it’s available for peer review. You can download all the code for the analysis and data used on the following link. (DOWNLOAD)
Data & Analysis
On the first table, we can see a summary for the 2 devices plus the real pool counts broken down by each day of the experiment.
(1.1) Pool Count
Recorded
SwiftSwim
Garmin
Experiment_2015_09_10_S_AN
92
92
103
Experiment_2015_09_11_S_AN
96
97
110
Experiment_2015_09_15_S_AN
91
81
104
Experiment_2015_09_22_S_AN
88
89
102
Experiment_2015_09_23_S_AN
92
86
102
Experiment_2015_10_12_S_AN
88
89
98
Experiment_2015_10_14_S_AN
92
92
104
On the second table we see a similar summary but for the number of Strokes.
(1.2) Stroke Count
Recorded
SwiftSwim
Garmin
Experiment_2015_09_10_S_AN
1037
999
1381
Experiment_2015_09_11_S_AN
1039
1005
1489
Experiment_2015_09_15_S_AN
1007
837
1409
Experiment_2015_09_22_S_AN
983
949
1332
Experiment_2015_09_23_S_AN
999
883
1357
Experiment_2015_10_12_S_AN
958
943
1343
Experiment_2015_10_14_S_AN
1044
1046
1404
Pool count and Stroke count errors
To calculate the errors on the pool and stroke counts, we used the procedure called Mean Absolute Error (MAE) which allows for a statistical comparison of the reported results from both devices to the control data from the real swim. This error is represented as a percentage. The smaller the error the better or more robust the accuracy. In addition to just calculating the error, we have evaluated if the error is relevant or if it’s just expected based on the mechanisms we used to measure the values. In order to calculate this relevance we used a technique called student’s T-test.
Based on the total number of Pool counts shown on table 1.1, the MAE for SwiftSwim is 3% and Garmin Swim is 13% On the stroke count (table 1.2), the MAE for SwiftSwim is 6% and for Garmin Swim is 37%. According to the T-test results (see appendix for details) none of Swift Swim’s errors are sufficiently large to be considered a meaningful error. Garmin Swim’s T-test on the other hand tells us that there are errors we cannot ignore and have a strong effect on the overall accuracy of the device. Moreover, in the case of the stroke counts, we can assume a measurement error equal to 1 stroke per pool, because the last stroke can be identified by some viewer as a stroke and for other viewer not a stroke. This one stroke per pool is an expected real error, and the T-test takes into account this expected error and tells us if the error on each device is between the ranges of the expected error.
These two errors can be easily visualized on the 2 graphs below. Graph 1.3 illustrates the distribution of Pools which is the same date found in table 1.1. You can see that there is a very important overlap between SwifSwim’s results and the results from the control, meaning that the difference on the distribution is insignificant. When we compare the distribution of the control data with the distribution of Garmin Swim’s data, there is almost no overlap in the distribution, meaning that there is a big gap between the two measurements.
This phenomena is even more visible when we compare the distribution of the number of Strokes on graph 1.4, where there is no overlap between the real measures and Garmin Swim’s measures. This is consistence with the results of the T-Tests which indicate a larger measurement error for Garmin Swim than Swift Swim in comparison to the control data.
Style identification accuracy
In order to estimate the accuracy of the identification of a swimming style, we use a procedure called a Confusion Matrix. This procedure matches and compares each pool swam on each device to the control data obtained from the recordings, using time as the main variable to synchronize each pool. Based on this procedure we found that the overall accuracy of SwiftSwim is 92% while Garmin is 50%. A full detailed result of this procedure is attached in the Appendix.
In order to better understand this procedure, we are illustrating two different confusion matrixes, one for each device. On this tables we represent the recorded styles (control data) on the horizontal axis and the experimental data by each device on the vertical axis. Basically, the accuracy is represented by the data found where the column and row with the same name merge. This represents where a particular style was correctly identified by the device. If you found a number different than cero on the rest of the rows for that particular column, that shows missed identifications by the devices. Basically the more numbers you find on the diagonal and the less on the rest, the better the overall accuracy. A similar representation is depicted on the Heat maps.
Confusion table
Heat maps
BACK
BREAST
BUTTERFLY
CRAWL
PAUSE
BACK
167
0
2
0
0
BREAST
0
133
0
0
1
BUTTERFLY
0
17
96
13
14
CRAWL
0
0
0
188
1
PAUSE
0
0
0
0
0
BACK
BREAST
BUTTERFLY
CRAWL
PAUSE
BACK
169
128
20
5
34
BREAST
4
8
16
2
30
BUTTERFLY
0
1
4
0
6
CRAWL
10
9
42
178
57
PAUSE
0
0
0
0
0
Another way to represent the accuracy differences in swimming styles is just by presenting the total amount of pools per style found in graph 1.5. Although it is not as accurate as the confusion matrix, one can clearly identify that there is a strong similarity between Swift Swim and the control data in comparison to Garmin Swim’s results.
Detailed record and analysis by date
By clicking on each date below, you can expand on the records and analysis for each day of the experiment. Moreover, we include the actual video so the analysis can be replicated by anybody interested.
Type
Time swam
Time paused
Pools
Strokes
ALL
01:01:13
00:10:35
92
1037
CRAWL
00:14:21
00:00:12
30
318
BACK
00:15:57
00:00:23
24
216
BUTTERFLY
00:05:32
00:08:23
14
127
BREAST
00:14:48
00:01:22
24
376
The table shown above illustrates each time a pool was finished along with the style and the number of strokes based on the recorded video.
SwiftSwim compared with Recored data
Garmin compared with Recored data
When we line up a graph of the control data with the graph generated by both devices, we can clearly see the differences. The first difference is that on each device compared with the control data, we can see based on the colors (which identify the styles) and the height (which identify the speed) where each one correctly identify the pool (or misses it). Second, we can visually see the accuracy of each device. The following graphs and tables will numerically calculate the accuracy of each device by using the confusion matrix method explained in Data & Analysis section.
Confusion Matrix for SwiftSwim
Confusion Matrix for Garmin
BACK
BREAST
BUTTERFLY
CRAWL
PAUSE
BACK
24
0
0
0
0
BREAST
0
19
0
0
0
BUTTERFLY
0
5
14
0
0
CRAWL
0
0
0
30
0
PAUSE
0
0
0
0
0
BACK
BREAST
BUTTERFLY
CRAWL
PAUSE
BACK
24
14
1
0
10
BREAST
0
4
2
0
5
BUTTERFLY
0
0
0
0
1
CRAWL
0
0
1
30
11
PAUSE
0
0
0
0
0
SwiftSwim Accuracy for Style Identification
94.57%
Garmin Accuracy for Style Identification
56.31%
SwiftSwim Pool count error
0%
Garmin Pool count error
12%
SwiftSwim Strokes count error
4%
Garmin Strokes count error
33%
To better understand the results, let's take a look at the total number of pools per Style and then put the three together to get a better visualization. As shown below, there is a large difference in accuracy amongst both devices because Swift Swim has a much stronger correlation to the control data that Garmin Swim in term of pool counts per style. This is not as accurate as the Confusion Matrix but it better illustrates the difference amongst the accuracy of the devices.
BACK
BREAST
BUTTERFLY
CRAWL
Garmin
49
11
1
42
Recorded
24
24
14
30
SwiftSwim
24
19
19
30
Type
Time swam
Time paused
Pools
Strokes
ALL
01:06:33
00:13:28
96
1039
CRAWL
00:11:15
00:00:32
24
252
BACK
00:18:52
00:00:08
28
252
BUTTERFLY
00:07:21
00:09:02
18
163
BREAST
00:15:37
00:03:38
26
372
The table shown above illustrates each time a pool was finished along with the style and the number of strokes based on the recorded video.
SwiftSwim compared with Recored data
Garmin compared with Recored data
When we line up a graph of the control data with the graph generated by both devices, we can clearly see the differences. The first difference is that on each device compared with the control data, we can see based on the colors (which identify the styles) and the height (which identify the speed) where each one correctly identify the pool (or misses it). Second, we can visually see the accuracy of each device. The following graphs and tables will numerically calculate the accuracy of each device by using the confusion matrix method explained in Data & Analysis section.
Confusion Matrix for SwiftSwim
Confusion Matrix for Garmin
BACK
BREAST
BUTTERFLY
CRAWL
PAUSE
BACK
28
0
0
0
0
BREAST
0
21
0
0
1
BUTTERFLY
0
5
18
3
0
CRAWL
0
0
0
21
0
PAUSE
0
0
0
0
0
BACK
BREAST
BUTTERFLY
CRAWL
PAUSE
BACK
28
22
1
0
5
BREAST
0
0
3
1
7
BUTTERFLY
0
0
2
0
0
CRAWL
2
4
10
20
5
PAUSE
0
0
0
0
0
SwiftSwim Accuracy for Style Identification
90.72%
Garmin Accuracy for Style Identification
45.45%
SwiftSwim Pool count error
1%
Garmin Pool count error
15%
SwiftSwim Strokes count error
3%
Garmin Strokes count error
43%
To better understand the results, let's take a look at the total number of pools per Style and then put the three together to get a better visualization. As shown below, there is a large difference in accuracy amongst both devices because Swift Swim has a much stronger correlation to the control data that Garmin Swim in term of pool counts per style. This is not as accurate as the Confusion Matrix but it better illustrates the difference amongst the accuracy of the devices.
BACK
BREAST
BUTTERFLY
CRAWL
Garmin
56
11
2
41
Recorded
28
26
18
24
SwiftSwim
28
22
26
21
Type
Time swam
Time paused
Pools
Strokes
ALL
01:01:40
00:10:39
91
1007
CRAWL
00:11:19
00:00:52
24
254
BACK
00:16:45
00:01:13
24
216
BUTTERFLY
00:09:50
00:06:42
22
199
BREAST
00:13:07
00:01:37
21
338
The table shown above illustrates each time a pool was finished along with the style and the number of strokes based on the recorded video.
SwiftSwim compared with Recored data
Garmin compared with Recored data
When we line up a graph of the control data with the graph generated by both devices, we can clearly see the differences. The first difference is that on each device compared with the control data, we can see based on the colors (which identify the styles) and the height (which identify the speed) where each one correctly identify the pool (or misses it). Second, we can visually see the accuracy of each device. The following graphs and tables will numerically calculate the accuracy of each device by using the confusion matrix method explained in Data & Analysis section.
Confusion Matrix for SwiftSwim
Confusion Matrix for Garmin
BACK
BREAST
BUTTERFLY
CRAWL
PAUSE
BACK
19
0
2
0
0
BREAST
0
12
0
0
0
BUTTERFLY
0
4
20
9
0
CRAWL
0
0
0
15
0
PAUSE
0
0
0
0
0
BACK
BREAST
BUTTERFLY
CRAWL
PAUSE
BACK
22
15
9
4
3
BREAST
3
2
1
1
2
BUTTERFLY
0
0
0
0
1
CRAWL
3
5
9
16
8
PAUSE
0
0
0
0
0
SwiftSwim Accuracy for Style Identification
81.48%
Garmin Accuracy for Style Identification
38.46%
SwiftSwim Pool count error
11%
Garmin Pool count error
14%
SwiftSwim Strokes count error
17%
Garmin Strokes count error
40%
To better understand the results, let's take a look at the total number of pools per Style and then put the three together to get a better visualization. As shown below, there is a large difference in accuracy amongst both devices because Swift Swim has a much stronger correlation to the control data that Garmin Swim in term of pool counts per style. This is not as accurate as the Confusion Matrix but it better illustrates the difference amongst the accuracy of the devices.
BACK
BREAST
BUTTERFLY
CRAWL
Garmin
53
9
1
41
Recorded
24
21
22
24
SwiftSwim
21
12
33
15
Type
Time swam
Time paused
Pools
Strokes
ALL
01:01:16
00:12:18
88
983
CRAWL
00:14:37
00:00:07
30
306
BACK
00:14:40
00:00:33
22
198
BUTTERFLY
00:05:50
00:09:55
14
126
BREAST
00:13:51
00:01:20
22
353
The table shown above illustrates each time a pool was finished along with the style and the number of strokes based on the recorded video.
SwiftSwim compared with Recored data
Garmin compared with Recored data
When we line up a graph of the control data with the graph generated by both devices, we can clearly see the differences. The first difference is that on each device compared with the control data, we can see based on the colors (which identify the styles) and the height (which identify the speed) where each one correctly identify the pool (or misses it). Second, we can visually see the accuracy of each device. The following graphs and tables will numerically calculate the accuracy of each device by using the confusion matrix method explained in Data & Analysis section.
Confusion Matrix for SwiftSwim
Confusion Matrix for Garmin
BACK
BREAST
BUTTERFLY
CRAWL
PAUSE
BACK
22
0
0
0
0
BREAST
0
21
0
0
0
BUTTERFLY
0
1
2
0
13
CRAWL
0
0
0
29
1
PAUSE
0
0
0
0
0
BACK
BREAST
BUTTERFLY
CRAWL
PAUSE
BACK
23
19
1
0
6
BREAST
1
1
2
0
8
BUTTERFLY
0
0
0
0
1
CRAWL
0
0
3
30
7
PAUSE
0
0
0
0
0
SwiftSwim Accuracy for Style Identification
83.15%
Garmin Accuracy for Style Identification
52.94%
SwiftSwim Pool count error
1%
Garmin Pool count error
16%
SwiftSwim Strokes count error
3%
Garmin Strokes count error
36%
To better understand the results, let's take a look at the total number of pools per Style and then put the three together to get a better visualization. As shown below, there is a large difference in accuracy amongst both devices because Swift Swim has a much stronger correlation to the control data that Garmin Swim in term of pool counts per style. This is not as accurate as the Confusion Matrix but it better illustrates the difference amongst the accuracy of the devices.
BACK
BREAST
BUTTERFLY
CRAWL
Garmin
49
12
1
40
Recorded
22
22
14
30
SwiftSwim
22
21
16
30
Type
Time swam
Time paused
Pools
Strokes
ALL
01:00:40
00:09:27
92
999
CRAWL
00:11:22
00:00:38
24
243
BACK
00:16:10
00:00:09
24
214
BUTTERFLY
00:09:19
00:06:46
22
199
BREAST
00:14:22
00:01:44
22
343
The table shown above illustrates each time a pool was finished along with the style and the number of strokes based on the recorded video.
SwiftSwim compared with Recored data
Garmin compared with Recored data
When we line up a graph of the control data with the graph generated by both devices, we can clearly see the differences. The first difference is that on each device compared with the control data, we can see based on the colors (which identify the styles) and the height (which identify the speed) where each one correctly identify the pool (or misses it). Second, we can visually see the accuracy of each device. The following graphs and tables will numerically calculate the accuracy of each device by using the confusion matrix method explained in Data & Analysis section.
Confusion Matrix for SwiftSwim
Confusion Matrix for Garmin
BACK
BREAST
BUTTERFLY
CRAWL
PAUSE
BACK
22
0
0
0
0
BREAST
0
18
0
0
0
BUTTERFLY
0
0
22
0
0
CRAWL
0
0
0
24
0
PAUSE
0
0
0
0
0
BACK
BREAST
BUTTERFLY
CRAWL
PAUSE
BACK
22
20
0
1
5
BREAST
0
1
4
0
3
BUTTERFLY
0
1
0
0
0
CRAWL
4
0
13
20
8
PAUSE
0
0
0
0
0
SwiftSwim Accuracy for Style Identification
100%
Garmin Accuracy for Style Identification
42.16%
SwiftSwim Pool count error
7%
Garmin Pool count error
11%
SwiftSwim Strokes count error
12%
Garmin Strokes count error
36%
To better understand the results, let's take a look at the total number of pools per Style and then put the three together to get a better visualization. As shown below, there is a large difference in accuracy amongst both devices because Swift Swim has a much stronger correlation to the control data that Garmin Swim in term of pool counts per style. This is not as accurate as the Confusion Matrix but it better illustrates the difference amongst the accuracy of the devices.
BACK
BREAST
BUTTERFLY
CRAWL
Garmin
48
8
1
45
Recorded
24
22
22
24
SwiftSwim
22
18
22
24
Type
Time swam
Time paused
Pools
Strokes
ALL
01:00:27
00:09:56
88
958
CRAWL
00:15:00
00:00:13
30
308
BACK
00:18:08
00:00:14
26
234
BUTTERFLY
00:05:46
00:08:30
14
128
BREAST
00:11:37
00:00:47
18
288
The table shown above illustrates each time a pool was finished along with the style and the number of strokes based on the recorded video.
SwiftSwim compared with Recored data
Garmin compared with Recored data
When we line up a graph of the control data with the graph generated by both devices, we can clearly see the differences. The first difference is that on each device compared with the control data, we can see based on the colors (which identify the styles) and the height (which identify the speed) where each one correctly identify the pool (or misses it). Second, we can visually see the accuracy of each device. The following graphs and tables will numerically calculate the accuracy of each device by using the confusion matrix method explained in Data & Analysis section.
Confusion Matrix for SwiftSwim
Confusion Matrix for Garmin
BACK
BREAST
BUTTERFLY
CRAWL
PAUSE
BACK
26
0
0
0
0
BREAST
0
16
0
0
0
BUTTERFLY
0
2
14
1
1
CRAWL
0
0
0
29
0
PAUSE
0
0
0
0
0
BACK
BREAST
BUTTERFLY
CRAWL
PAUSE
BACK
26
16
5
0
1
BREAST
0
0
2
0
3
BUTTERFLY
0
0
0
0
2
CRAWL
0
0
2
30
11
PAUSE
0
0
0
0
0
SwiftSwim Accuracy for Style Identification
95.51%
Garmin Accuracy for Style Identification
57.14%
SwiftSwim Pool count error
1%
Garmin Pool count error
11%
SwiftSwim Strokes count error
2%
Garmin Strokes count error
40%
To better understand the results, let's take a look at the total number of pools per Style and then put the three together to get a better visualization. As shown below, there is a large difference in accuracy amongst both devices because Swift Swim has a much stronger correlation to the control data that Garmin Swim in term of pool counts per style. This is not as accurate as the Confusion Matrix but it better illustrates the difference amongst the accuracy of the devices.
BACK
BREAST
BUTTERFLY
CRAWL
Garmin
48
5
2
43
Recorded
26
18
14
30
SwiftSwim
26
16
18
29
Type
Time swam
Time paused
Pools
Strokes
ALL
01:00:54
00:08:26
92
1044
CRAWL
00:15:58
00:00:10
32
339
BACK
00:16:46
00:00:13
24
216
BUTTERFLY
00:05:51
00:07:43
14
128
BREAST
00:13:53
00:00:12
22
361
The table shown above illustrates each time a pool was finished along with the style and the number of strokes based on the recorded video.
SwiftSwim compared with Recored data
Garmin compared with Recored data
When we line up a graph of the control data with the graph generated by both devices, we can clearly see the differences. The first difference is that on each device compared with the control data, we can see based on the colors (which identify the styles) and the height (which identify the speed) where each one correctly identify the pool (or misses it). Second, we can visually see the accuracy of each device. The following graphs and tables will numerically calculate the accuracy of each device by using the confusion matrix method explained in Data & Analysis section.
Confusion Matrix for SwiftSwim
Confusion Matrix for Garmin
BACK
BREAST
BUTTERFLY
CRAWL
PAUSE
BACK
24
0
0
0
0
BREAST
0
22
0
0
0
BUTTERFLY
0
0
14
0
0
CRAWL
0
0
0
32
0
PAUSE
0
0
0
0
0
BACK
BREAST
BUTTERFLY
CRAWL
PAUSE
BACK
24
22
3
0
4
BREAST
0
0
2
0
2
BUTTERFLY
0
0
2
0
1
CRAWL
1
0
4
32
7
PAUSE
0
0
0
0
0
SwiftSwim Accuracy for Style Identification
100%
Garmin Accuracy for Style Identification
55.77%
SwiftSwim Pool count error
0%
Garmin Pool count error
13%
SwiftSwim Strokes count error
0%
Garmin Strokes count error
34%
To better understand the results, let's take a look at the total number of pools per Style and then put the three together to get a better visualization. As shown below, there is a large difference in accuracy amongst both devices because Swift Swim has a much stronger correlation to the control data that Garmin Swim in term of pool counts per style. This is not as accurate as the Confusion Matrix but it better illustrates the difference amongst the accuracy of the devices.
BACK
BREAST
BUTTERFLY
CRAWL
Garmin
53
4
3
44
Recorded
24
22
14
32
SwiftSwim
24
22
14
32
Appendix.
Detailed Statistics
T.test results for Pool error evaluation on SwiftSwim
##
## 	Welch Two Sample t-test
##
## data:  all_pools$Recorded and all_pools$SwiftSwim
## t = 0.85288, df = 9.2616, p-value = 0.4152
## alternative hypothesis: true difference in means is not equal to 0
## 95 percent confidence interval:
##  -3.047573  6.761858
## sample estimates:
## mean of x mean of y
##  91.28571  89.42857
T.test results for Pool error evaluation on Garmin Swim
##
## 	Welch Two Sample t-test
##
## data:  all_pools$Recorded and all_pools$Garmin
## t = -7.0163, df = 11.238, p-value = 1.986e-05
## alternative hypothesis: true difference in means is not equal to 0
## 95 percent confidence interval:
##  -15.754685  -8.245315
## sample estimates:
## mean of x mean of y
##  91.28571 103.28571
T.test results for Stroke count error evaluation on SwiftSwim
We assume (+/-) one stroke per pool error while recording, this is why we adjust for this error
##
## 	Welch Two Sample t-test
##
## data:  all_strokes$Recorded and all_strokes$SwiftSwim
## t = 0.40491, df = 8.2749, p-value = 0.6958
## alternative hypothesis: true difference in means is not equal to 45.64286
## 95 percent confidence interval:
##  -11.30348 127.01777
## sample estimates:
## mean of x mean of y
## 1009.5714  951.7143
T.test results for Stroke count error evaluation on Garmin Swim
We assume (+/-) one stroke per pool error while recording, this is why we adjust for this error
##
## 	Welch Two Sample t-test
##
## data:  all_strokes$Recorded and all_strokes$Garmin
## t = -17.977, df = 9.8923, p-value = 6.997e-09
## alternative hypothesis: true difference in means is not equal to 45.64286
## 95 percent confidence interval:
##  -430.9072 -325.6642
## sample estimates:
## mean of x mean of y
##  1009.571  1387.857
Compleate ConfusionMatrix results for SwiftSwim full experiment
## Confusion Matrix and Statistics
##
##            Reference
## Prediction  BACK BREAST BUTTERFLY CRAWL PAUSE
##   BACK       167      0         2     0     0
##   BREAST       0    133         0     0     1
##   BUTTERFLY    0     17        96    13    14
##   CRAWL        0      0         0   188     1
##   PAUSE        0      0         0     0     0
##
## Overall Statistics
##
##                Accuracy : 0.9241
##                  95% CI : (0.9006, 0.9435)
##     No Information Rate : 0.318
##     P-Value [Acc > NIR] : < 2.2e-16
##
##                   Kappa : 0.8987
##  Mcnemar's Test P-Value : NA
##
## Statistics by Class:
##
##                      Class: BACK Class: BREAST Class: BUTTERFLY
## Sensitivity               1.0000        0.8867           0.9796
## Specificity               0.9957        0.9979           0.9176
## Pos Pred Value            0.9882        0.9925           0.6857
## Neg Pred Value            1.0000        0.9659           0.9959
## Prevalence                0.2642        0.2373           0.1551
## Detection Rate            0.2642        0.2104           0.1519
## Detection Prevalence      0.2674        0.2120           0.2215
## Balanced Accuracy         0.9978        0.9423           0.9486
##                      Class: CRAWL Class: PAUSE
## Sensitivity                0.9353      0.00000
## Specificity                0.9977      1.00000
## Pos Pred Value             0.9947          NaN
## Neg Pred Value             0.9707      0.97468
## Prevalence                 0.3180      0.02532
## Detection Rate             0.2975      0.00000
## Detection Prevalence       0.2991      0.00000
## Balanced Accuracy          0.9665      0.50000
Compleate ConfusionMatrix results for Garmin Swim full experiment
## Confusion Matrix and Statistics
##
##            Reference
## Prediction  BACK BREAST BUTTERFLY CRAWL PAUSE
##   BACK       169    128        20     5    34
##   BREAST       4      8        16     2    30
##   BUTTERFLY    0      1         4     0     6
##   CRAWL       10      9        42   178    57
##   PAUSE        0      0         0     0     0
##
## Overall Statistics
##
##                Accuracy : 0.4965
##                  95% CI : (0.4595, 0.5336)
##     No Information Rate : 0.2559
##     P-Value [Acc > NIR] : < 2.2e-16
##
##                   Kappa : 0.3306
##  Mcnemar's Test P-Value : < 2.2e-16
##
## Statistics by Class:
##
##                      Class: BACK Class: BREAST Class: BUTTERFLY
## Sensitivity               0.9235       0.05479         0.048780
## Specificity               0.6537       0.90988         0.989080
## Pos Pred Value            0.4747       0.13333         0.363636
## Neg Pred Value            0.9619       0.79186         0.890449
## Prevalence                0.2531       0.20194         0.113416
## Detection Rate            0.2337       0.01107         0.005533
## Detection Prevalence      0.4924       0.08299         0.015214
## Balanced Accuracy         0.7886       0.48234         0.518930
##                      Class: CRAWL Class: PAUSE
## Sensitivity                0.9622       0.0000
## Specificity                0.7807       1.0000
## Pos Pred Value             0.6014          NaN
## Neg Pred Value             0.9836       0.8243
## Prevalence                 0.2559       0.1757
## Detection Rate             0.2462       0.0000
## Detection Prevalence       0.4094       0.0000
## Balanced Accuracy          0.8714       0.5000